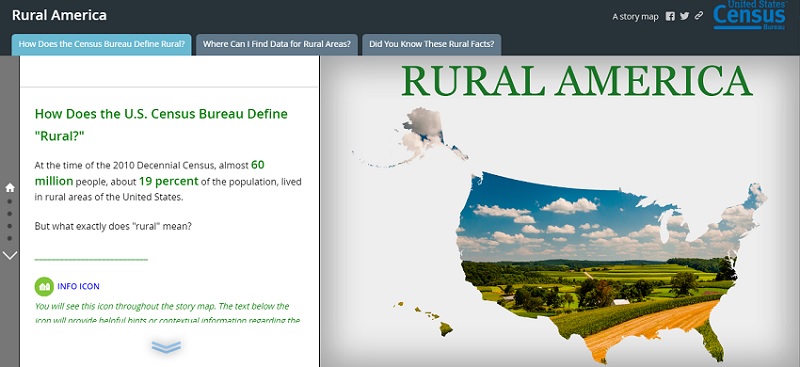
With a new story map, the U.S. Census Bureau is trying to clarify what “rural” means.
The story map is based on data from Census’ latest American Community Survey (ACS), which offers small area statistics breaking down the social, economic, housing, and demographic characteristics of a region. The map contains ACS data on 40 different topics, from languages spoken at home to the number of veterans in an area.
According to Suzanne McArdle, a computer mapping specialist within Census’ geography division, the chief goal of the story map is to clarify the definition of “rural.” While most people consider “rural” a place with pastures and livestock, Census’ website defines it as “any population, housing, or territory not in an urban area.” People can visit the story map and, through images and graphs, gain a better understanding of the word, McArdle stated.
“The story map model is really helpful because it provides a multimedia experience,” McArdle said. “It is more of an explanatory tool.”
McArdle said Census is using the metrics on the ACS story map to shape how they build future story maps. She and her team are currently developing a story map from Census’ planning database, which reveals areas with “low response” scores. These “low response” areas are places that have a low survey response rate. Analyzing these areas will help surveyors tailor their polls toward certain populations to garner more responses, McArdle said.
The ACS data story map was launched in early December; McArdle and her team started working on it in August. As of Jan. 17, the story map has received 2,691 views. McArdle stated that the ACS story map serves as a precious source of information for rural communities.
“This data is incredibly important,” McArdle said. “It’s the only picture or lifeline into that data.”
