Numbers crunchers looking for more Federal data to feast on, look no further. Today, analytics.usa.gov–an official site of the General Services Administration, powered by the Data Analytics Program (DAP)–added to its site an agency-specific, drop-down menu to filter analytics for the following 10 Federal agencies’ sites:
Department of Commerce
Department of Education
Department of Energy
Department of the Interior
Department of Justice
Department of Veterans Affairs
Environmental Protection Agency
National Aeronautics and Space Administration
National Archives and Records Administration
Small Business Administration
The original DAP page offers a dashboard with analytics from 39 Federal sites. The analytics for all of those sites, however, are aggregated and not broken down individually.
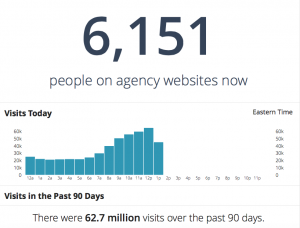
Let’s look at an example of a new DAP Federal agency analytics page. Below, this portion of the dashboard shows the number of visitors currently on the NASA site. It also gives an hourly breakdown of traffic for that day in bar graph form.
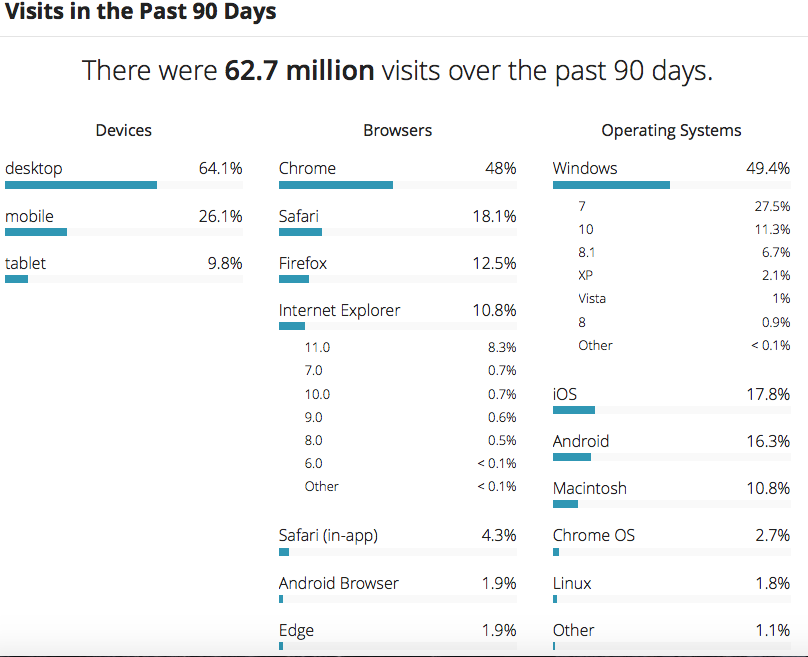
Next on the NASA dashboard is the “Visits in the Past 90 days” portion. It gives a percentage breakdown of visitors by their devices, browsers, and operating systems.
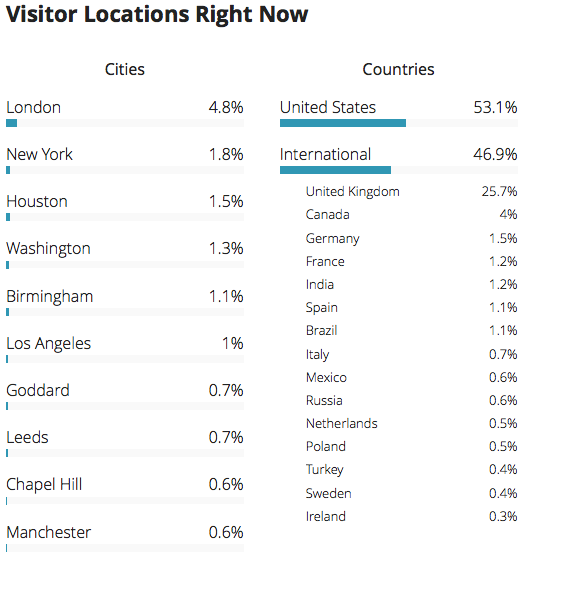
The bottom third of the dashboard provides city-by-city and country-by-country analytics for the NASA site.
Lastly, this right column displays the top pages within the NASA agency site at the moment. The “7 Days” and “30 Days” tabs track visitors to the entire NASA site within those time frames.

According to its website, DAP collects analytics from 4,000 websites. DAP calls these first 10 Federal pages its initial “batch,” and it hopes to include more Federal agencies in the future.